The Rising Average Driver Ball Speed On Tour Means One Thing!


If you’ve watched any Tour event recently, there is always a common thread in the commentary: distance, especially off the tee.
As modern technology and athletic training have evolved, so too has the importance of driver ball speed. With every swing displayed on our screens, ball speed takes center stage, dictating just how far that ball flies.
The current average driver ball speed on the PGA Tour is 173.63 mph, according to the latest ShotLink stats.
This represents a steady increase of 0.78 mph from last year and marks a hugely significant 8.27 mph increase from the average driver ball speed recorded in 2007 when this metric first began being tracked on Tour.
But what’s driving this surge?
When you delve deeper into the average driver ball speed numbers across all the major Tours the reason why the best athletes – for that is what they are now – are now constantly searching for ever more driver ball speed is laid bare.
And what is more, it seems absolutely clear that this quest for more ball speed amongst the top pros is not going to stop any time soon!
Golfing Focused Key takeaways For Time Pressed Golfers
- The current average driver ball speed on the PGA Tour is 173.63 mph, up a massive 8.27 mph from 165.36mph in 2007
- Each 1 mph increase in ball speed can add up to 2 yards of driving distance
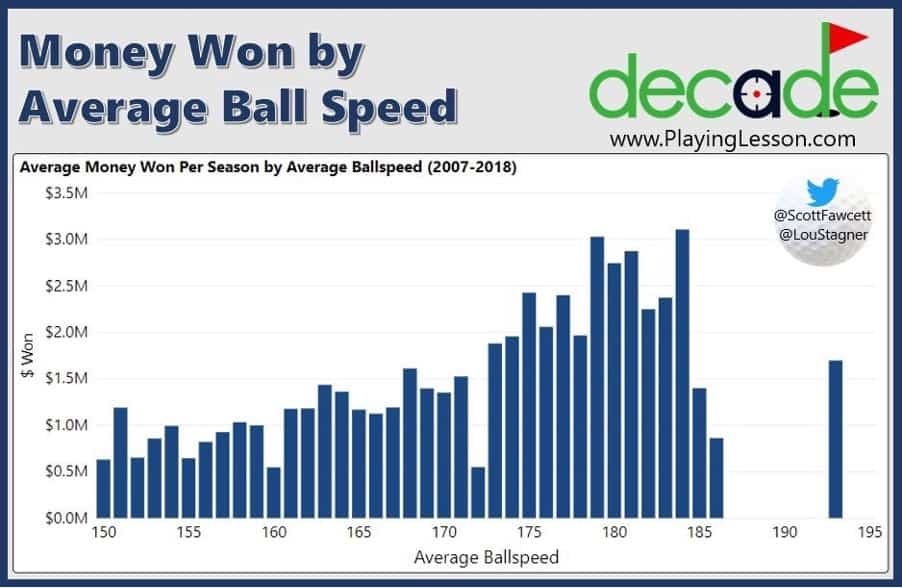
- Higher ball speeds correlate strongly with PGA Tour earnings – the top 20 money winners average 177.31 mph
- LPGA Tour pros average 143 mph driver ball speed, demonstrating exceptional efficiency with similar swing speeds to male amateurs
More Average Driver Ball Speed On Tour = More Distance = More Money!
When a trend is seen in the professional ranks of a sport like golf, where millions of dollars are at stake, there is going to be a good reason why it is happening.
And the rising average driver ball speed on the PGA Tour and other major Tours is definitely a trend.
Since Shotlink started tracking this stat on Tour in 2007 it has risen almost every year.
On the LPGA Tour by comparison Trackman has noted a 3 mph increase in their latest averages while on the Champions Tour Padraig Harrington consistently clocks nearly 180 mph in tournament play.
Some point to the fact that these are small increases – a seemingly minor 0.51 mph per year on the PGA Tour from 2007 to 2024 – but while this is a small number, it makes a big difference to Tour players.
Pro tip: Ball speed is the single biggest factor in how far a golf ball ‘actually‘ carries and is not to be confused with club head/swing speed which is the key factor for determining a golfer’s ‘potential‘ distance. Ball speed is often judged by ‘smash factor’ which is calculated by dividing ball speed by club/swing speed. The closer the smash factor to the perfect score of 1.5 the better the energy transfer from the club to the ball.
The logic is simple: more ball speed means more distance.
And more distance in turn, plays a pivotal role in determining the success of all standards of golfers including the best pros in the world.
Lets consider the following two stats:
- A 1 mph increase in driver ball speed can add up to 2 yards of carry distance according to Trackman
- An extra 20 yards of driving distance can reduce a pro’s score by up to three-quarters of a stroke per round.
3/4 of a stroke per round may not sound much but on Tour the financial implications are staggering.
Consider this: In 2024, Maverick MacNealy, with a scoring average of 70.1 earned over $4.7 million. Compare that to Jordan Speith whose slightly higher scoring average of 70.84 relegated him to $2.7 million in earnings.
That fractional difference in performance of almost three-quarters of a stroke per round equated to a gap of more than $2 million in prize money!
As Professor Mark Broadie, the pioneer of modern golf stats, famously noted: “Golfers who can’t hit it long and straight never even make it to the Tour.”
Not that we should feel too bad for pro golfers who earn millions of dollars but the key point to take away is simply this.
On the PGA Tour more average driver ball speed equals more distance which in turn on average means more prize money.
And just to emphasize how much PGA Tour pros are now focused on driver ball speed you need only look at the number of them averaging a driver ball speed of 170mph on Tour over the years.
That driver ball speed benchmark used to put pros into the elite. Today it’s below average and indeed is a ball speed that will more than likely cost a PGA pro his place on the Tour!

What Is The Fastest Driver Ball Speed On The PGA Tour?
Information on the steadily rising average driver balls speeds on Tour is all very well but when it comes to anything to do with speed people quickly want to know who is the fastest.
Among the elite on the PGA Tour, Cameron Champ continues to lead the pack, having recorded the top average driver ball speed of 190.12 mph during the 2024 season.
Bryson DeChambeau meanwhile continues to hold the fastest ‘individual’ driver ball speed record on Tour with the 199.55 mph speed he achieved in the 2020-21 season.
However he has also reached an incredible speed of 219 mph in world long drive championship competition!
For context, here’s a look at the fastest average driver ball speeds on Tour in recent years:
| YEAR | FASTEST AVERAGE DRIVER BALL SPEED |
| 2007 | 182.88 mph (Bubba Watson) |
| 2008 | 184.35 mph (J.B.Holmes) |
| 2009 | 183.73 mph (Bubba Watson) |
| 2010 | 182.61 mph (Bubba Watson) |
| 2011 | 185.73 mph (J.B.Holmes) |
| 2012 | 184.98 mph (Bubba Watson) |
| 2013-14 | 183.48 mph (Bubba Watson) |
| 2014-15 | 184.54 mph (Bubba Watson) |
| 2015-16 | 184.57 mph (Andrew Loupe) |
| 2016-17 | 186.79 mph (Brendon Hagy) |
| 2017-18 | 182.22 mph (Trey Mullinax) |
| 2018-19 | 190.70 mph (Cameron Champ) |
| 2019-20 | 189.18 mph (Cameron Champ) |
| 2020-21 | 190.94 mph (Cameron Champ) |
| 2021-22 | 188.94 mph (Cameron Champ) |
| 2022-23 | 190.26 mph (Cameron Champ) |
| 2024 | 190.12 mph (Cameron Champ) |
Source: PGA Tour (Shotlink)
But these Tour records are dwarfed by the achievements of long-drive specialists.
Kyle Berkshire and Sam Attanasio, for example, have been trading driver ball speed records in recent years with Attanasio recently matching his own ball speed world record of a staggering 245 mph.
Putting that into context that is an average ball speed just under 60mph faster than Rory McIlroy’s average on Tour, close to 62 mph more than Xander Schauffele and over 68 mph faster than Scottie Scheffler’s.
What should be noted though is that compared to the long-driving specialists the Tour pros are likely not hitting their drives at top speed when you watch them play tournaments.
To maintain control they will often dial back from what they could achieve should they really go for it with driver and not worry about where the ball goes.
So when you next watch your favourite players on TV just bear in mind that they more than likely have more in the tank!
What About The Average LPGA & Champions Tour Driver Ball Speed?
When it comes to Tour golf the focus is most often on the men’s game.
Unfortunately Trackman or other launch monitor manufacturers do not publish stats on the average driver balls speed on the Champions Tour.
Golfing Focus has noted though the longest driver on the senior Tour, Padraig Harrington, regularly posting ball speeds close to 180 mph in tournament play and even over 190 mph in practice.
These numbers clearly suggest the best senior pros are also looking to maximise driver ball speed as much as their main Tour colleagues although there is no concrete Champions Tour wide data to point to that as there is on the PGA Tour.
But a look at the average driver ball speed on the LPGA Tour shows it also reflects a trend toward increasing driver ball speeds.
Since the great Laura Davies topped the LPGA Tour driving chart in 1993 with an average distance of close to 255 yards, Natthakritta Vongtaveelap has added another 35 yards to that mark 20 years later.
And that means driver ball speeds have been rising on the LPGA Tour also.
The average driver ball speed on the LPGA Tour is now 143 mph according to Trackman rising from 140 mph the last time they reported their Tour averages a few years back.
World No. 1 Nelly Korda meanwhile, together with other longer hitters including Maria Fassi, produce ball speeds over 150mph.
And while these numbers are well short of their male counterparts they show the best women pros are equally focused on distance and driving up their ball speed numbers.
| LPGA TOUR PLAYER | TYPICAL DRIVER BALL SPEED | vs. LPGA TOUR AVERAGE (143 mph) |
| Nelly Korda | 153 mph | +10 mph |
| Lydia Ko | 140 mph | – 3 mph |
| Brooke Henderson | 148 mph | +5 mph |
| Lexi Thompson | 152 mph | +9 mph |
| Emily Pedersen | 150 mph | +7 mph |
| Maria Fassi | 156 mph | +13 mph |
Interestingly LPGA Tour pros are also able to generate these balls speeds with similar club or swing speeds to those of the average male amateur.
While average male amateurs average around 225 yards with their driver LPGA Tour pros average over 257 yards by comparison.
That’s an enormous difference of over 30 yards and highlights the value of superior ball striking when it comes to maximising driver distance.
So if you’re a regular male amateur player and looking at driver ball speeds on Tour you should probably be comparing yourself against the LPGA Tour pros rather than the PGA Tour elite.
What This Means for Amateur Golfers
While most amateurs won’t achieve PGA Tour ball speeds, understanding these numbers provides valuable context.
The LPGA Tour average of 140mph with similar swing speeds to male amateurs for example demonstrates the importance of efficient strike and technique over raw power.
So when it comes to increasing your driver ball speed and distance you the the ball here are some things to focus on:
- Improving strike quality through lessons and practice
- Understanding your current ball speed via launch monitor sessions
- Setting realistic goals based on your swing speed
- Working with a qualified instructor to optimize your efficiency
Before You Go …
For more context on where your own driver ball speed sits amongst your regular golfing peers check out our next article’s deep dive into average driver ball speed numbers for regular golfers broken down by handicap and age.
The FULL Guide To What Is a Good Ball Speed For A Driver
Or to see what your driver distance should be based on the ball speed you generate check out this post.
How Far Should Your Ball Speed Go? 100mph All the Way to 210mph!
Other great posts related to this topic:
- How Far Should You Hit a Driver? FULL GUIDE By Age, Handicap etc.
- A Look At What Is A ‘Good’ Drive, What’s Bad And What’s Average
- The Complete Guide To How Far Should A Woman Hit A Driver
- Breaking Down The Average Driver Swing Speed For Women
- What Should Your Driver Attack Angle Be? Try Not to Be Negative
- Why Don’t Your Drives Go Far? Slow and Steady Loses the Race
- What Determines Driver Distance? Skill Triumphs Over All!
- 10 Ways to Get More Distance off The Tee With & Without Speed!
- Ideal Spin Rate and Launch Angle for Driver? That’s Personal!
- What Should Your Driver Attack Angle Be? Try Not to Be Negative
- How Much Does Driver Loft Affect Distance? Loft is Dynamic Too!
- Where is the Sweet Spot on the Driver Face? Take the High Road
- How Far Does a 3 Wood vs 5 Wood Go? Tee and Approach Shots!
- How Far Should I Hit My Hybrids? 2 vs 3 vs 4 Hybrid Distances
- How Far Should I Hit My Irons? By Handicap, Age & Swingspeed
- How Far Should You Hit Your Wedges? Be Sure to Fill the Gaps!
- Going The Distance? How Far Should Beginners Hit A Golf Ball?
- Do All Golf Balls Go the Same Distance? Physics First
- Are Driving Range Distances Accurate? Golf Balls are a Problem
- What is Considered a Long Golf Course? The Long and Short of It
RECENT ARTICLES


LEGAL INFORMATION
This site is owned and operated by Golfing Focus Limited, a private limited company whose registered office is in London, UK. Golfing Focus Limited is a participant in the Amazon Services LLC Associates Program, an affiliate advertising program designed to provide a means for sites to earn advertising fees (at no cost to you) by linking to Amazon.com. Golfing Focus Limited also participates in other affiliate programs with the eBay Partner Network, FlexOffers, CJ.com, Svorn and other sites and is compensated for referring traffic and business to these companies (again at no cost to you).
Our Socials
Leave a Reply